CEOs and CFOs often ask, “So, what is goal-based planning?”
My answer is always, “You probably use it every day. Let me explain…”

CEOs and CFOs often ask, “So, what is goal-based planning?”
My answer is always, “You probably use it every day. Let me explain…”

We have recently developed an introductory course for the Oil & Gas industry in partnership with PetroLessons.
If you influence or make portfolio decisions for your company this course is for you!
Introduction to Portfolio Analysis illustrates the use of “portfolio analysis” to develop and compare alternative strategies that an O&G company might pursue. The examples included throughout the course show how projects and corporate performance measures interact and how the interactions create new opportunities for the corporation. The interactions can be quantified to allow decision-makers to compare alternate strategies and quickly assess the business performance trade-offs they will likely face when they select one strategy over another.
The course covers:
Who should take this course:
Benefits/ Course Objectives:
Understand how using a portfolio approach to select projects and analyze different strategies can improve the organization’s performance, and how the culture may need to change to enable a better dialog between the financial planning team and the operating units. You will also see how using multiple forecasts, with probabilities, can enhance your insight into different strategies.

“I don’t want any yes-men around me. I want everybody to tell me the truth even if it costs them their job.”
— Samuel Goldwyn
Goldwyn’s movie industry, with blockbusters and flops, has to deal with the uncertainty of knowing whether moviegoers will show up in sufficient numbers to pay all the costs of production, marketing, and distribution, and still return a profit. Is it “true” that the latest release be an “Avatar” (one of highest grossing movies) or a “Cutthroat Island” (biggest flop)?
There is uncertainty in any forecast, as with the hurricane path forecast above, and yet many companies continually ignore that uncertainty when planning a company’s future. You can attempt to reduce the uncertainty by gathering more information, but at some point the cost in time and money to do so will exceed the value of reduced uncertainty.
If missing a forecast is punished, employees will adjust their forecasts accordingly, attempting to avoid punishment. This usually leads to inflated budgets, lengthened schedules, and lower sales targets. And knowing this “sandbagging” occurs, executives reduce the budgets further, shorten the schedules more, and increase the sales targets. And the cycle continues…
As an executive, you should want to know what is the possible range of results, so that your company can plan accordingly. You should still set challenging goals, but you can get an idea of how likely those goals are to be achieved if your teams provided a range of forecasts.
Our npv10 product makes it simple to provide multiple forecasts for each product line, business unit, project, location, or however else you subdivide your business. Using these, we run hundreds of simulations to generate a range of results across your entire business, and calculate the range of results for all of your key performance indicators.
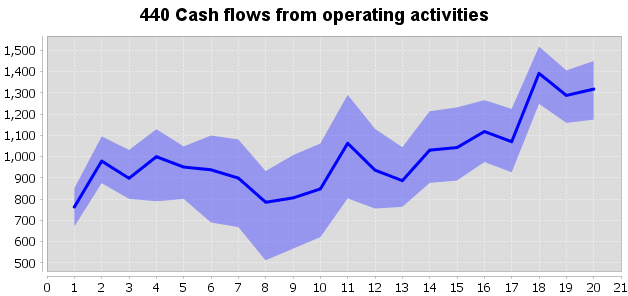
The above chart shows the “80% Confidence” range for Cash Flow from about 40 different projects a company had in various stages of development. Some of the established products had little uncertainty in their forecasts, and new projects further out had more. The greatest total uncertainty was about 2 years (8 quarters) out as some older products tailed off, and newer products were starting to take off. The 80% represents the number of simulated results that fell in the range, with 10% of results falling above the shaded range, and 10% below. The dark blue line is the weighted average of the forecasts (not simulated).
How does knowing this uncertainty help you manage your business? You may set internal goals in the upper range, but provide external forecasts somewhere in the lower range. You can also plan for the extremes, knowing ahead of time what you will do to react to these alternative outcomes.
And scenario planning is not just for the downside. If you have wildly successful projects, you may need to react quickly to increase personnel to support those, or may need additional working capital to handle cash flow timing issues. Knowing ahead of time what you will do enables you to best prepare, and not be forced to react in real-time, leading to less optimal results.
If you want help managing your organization’s uncertainty, contact us, and we will show you how to embrace uncertainty.